Last month, the Conservative Party pledged to cap energy prices in its 2017 manifesto, in order to tackle spiralling household energy bills. The government’s policy echoed a similar policy to the 20-month energy price freeze proposed by the former Labour leader, Ed Miliband, ahead of the 2015 election. However, the Conservatives added that their ambition is for the UK to have “the lowest energy costs in Europe, both for households and businesses”. But how do energy prices in the UK compare to other EU countries? The Department for Busines, Energy & Industrial Strategy (BEIS) recently published data for domestic electricity prices in the EU for the period July to December 2016. The latest data, which covers the EU-15 showed signifcant differences in household and industrial electricity prices across member countries.
Household electricity prices
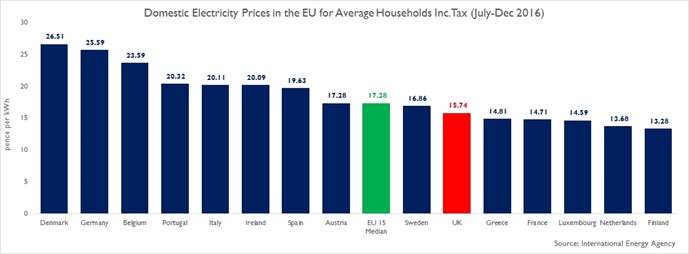
Since 2008, household electricity prices in the UK increased 26.7% to reach 0.155 per kWh in 2016. For the same period, Greece experienced the largest price increase (64.7%), followed by Portugal (61.1%) and Spain (57.1%). Prices in the Netherlands however, were 7.5% lower in 2016 compared to 2008. Furthermore, in the second half of 2016, household electricity prices in the UK were 0.157 pence per kWh, 8.9% lower than the EU-15 average of 0.173 per kWh. The UK’s electricity prices for households were ranked the sixth cheapest out of 15 in 2016 H2, owing to comparatively low government policy costs and VAT. According to a report published by the former DECC in 2014, VAT accounted for 5% of total household electricity bills during that year. The full breakdown shows that energy and climate change policies also accounted for a small proportion (10%), whilst wholesale energy costs (40%), network costs (24%) and supplier costs and margins (21%) accounted for a large share.
Overall, the country with the highest electricity prices in the second half of 2016 was Denmark, followed by Germany and Belgium (see Figure 1), whilst the country with the lowest price was Finland, followed by the Netherlands and Luxembourg. Correspondingly, according to Eurostat, the share of taxes and levies (inlcuding VAT) within the total price of electricity was the highest in Denmark, followed by Germany and Portgual.
Figure 1
Indeed there are other reasons as to why household electricity prices vary across countries in the EU, including the differing impact of global commodity prices, government policies, wholesales costs but here we take a look at the level of energy efficiency of housing stock, which appears to have significant influence on bills. Of course, the UK has relatively low unit costs for domestic electricity, but our high energy bills suggest that we have a greater usage than our EU counterparts.
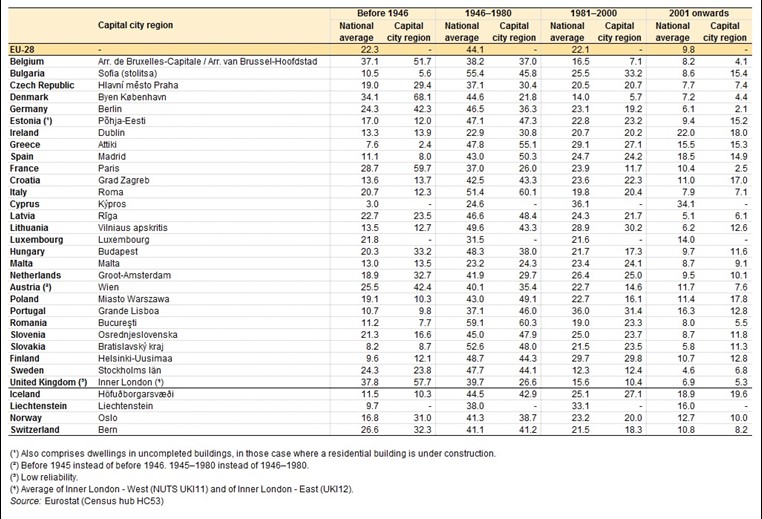
The UK’s housing stock is among the least energy efficient compared to other countries elsewhere in Europe. Figure 2 shows that the UK’s housing stock profile largely consists of homes built pre-1946 (37.8%) and among the lowest built post-2001(6.9%). Other countries in the EU-28 have a similar profile, with a large proportion of their housing built during the period 1964-1980.
The UK’s profile suggests low energy efficiency and, thus, it is not surprising why electricity bills are still relatively high. Consequently, our housing stock would benefit from adjustment of incentives on retrofit, instead of energy consumption through price caps. Although the government has introduced a number of policies in recent years to boost energy efficiency such as Green Deal and the Energy Company Obligation (ECO), little work has been seen under these schemes, suggesting there is still a long way to go for the UK to improve the efficiency of its exisiting housing stock relative to other EU countries. Neverthless, according to the Committee on Climate Change, improvements in energy efficiency undertaken by households have to led to savings of around £290 per year since 2008.
Figure 2: Distribution of dwellings by period of construction in EU-28 (% of all dwellings)
Industrial electricity prices
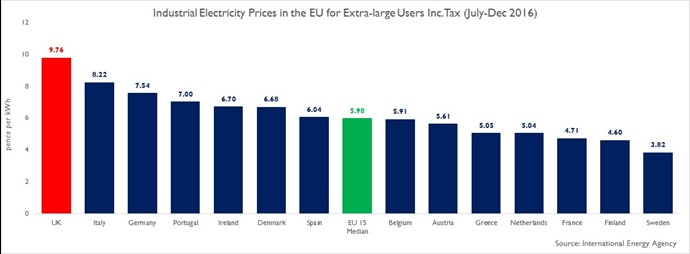
The picture was less for rosey industrial users (also known as extra-large users), with the price of electricity in the UK the highest in the EU-15. In the UK, electricity prices have been on an upward trajectory since 2010, rising 40.2% to 0.096 per kWh in 2016. Ireland and Portugal also experienced robust growth over the same period, whilst ten EU countries witnessed a falling trend in prices – with the Netherlands and Sweden recording the largest price decreases. Furhermore, the latest data showed that electricity prices for industrial users reached 0.098 per kWh in the second half of 2016, 63.2% higher than the EU-15 average of 0.060 per kWh (see Figure 3).
Although there are a number of reasons behind this significant difference in industrial electricity prices in the UK and other EU-15 countries, climate change policies form a substantial part of the explanation. Heavy side users of electricity such as steel, cement and engineering companies that fall in the extra-large category, have experienced high electricity costs, owing to policies designed to combat climate change. Another reason for the difference can be explained by the low cost of wholesale electricity and commodity prices across the EU countries, particulary in France and Sweden. Finally, the costs of transporting electricity from generators to consumers also varies from country to country.
Recognising the costs, especially those associated with policy, the UK government has introduced a package of compensation measures for electricity intensive industries over recent years including, up to 90% relief on the electricity Climate Change Levy (CCL), up to 85% compensation of the costs of the Rewewables Obligation (RO) and a cap on the Carbon Price Support (CPS). However, it appears that other European countries have reacted faster to offset such policy costs. Similar to the UK, France, Germany, Denmark and Italy have also implemented measures to reduce the costs related with government energy and climate change policies. France and Germany also provide their industrial sectors with different reductions on transportation fees.
Figure 3
Overall, it is evident that electricity prices in the UK paint a mixed picture. While they remain high for heavy side users, they remain low for households, suggesting that the former is bearing the brunt of costs. Whilst proposals for a domestic price cap largely equate to incentives to continue consuming energy, it appears the easy – and populist – policy option. After all, how many homeowners would prioritise energy-efficient retrofit such as solid wall insulation or boiler replacement over a new kitchen or extension?